
States with the Most (& Least) Gun Deaths [+ Causes]
Explore the alarming disparity of gun deaths across states: uncover the highest and lowest numbers, delve into underlying causes, and shed light on the urgent need for comprehensive measures to address this pressing societal concern. Gain valuable insights into the complex web of factors affecting communities and join the conversation for meaningful change.
Read more![]() Secured with SHA-256 Encryption
Secured with SHA-256 Encryption


Compare Quotes From Top Companies and Save
Life insurance policies starting at less than $1/day


Table of Contents
Table of Contents

Professor of Nutrition & Kinesiology
Melissa Morris has a BS and MS in exercise science and a doctorate in educational leadership. She is an ACSM certified exercise physiologist and an ISSN certified sports nutritionist. She teaches nutrition and applied kinesiology at the University of Tampa. She has been featured on Yahoo, HuffPost, Eat This, Bulletproof, LIVESTRONG, Toast Fried, The Trusty Spotter, Best Company, Healthl...
Melissa Morris

Licensed Insurance Agent
Eric Stauffer is an insurance agent and banker-turned-consumer advocate. His priority is educating individuals and families about the different types of insurance coverage. He is passionate about helping consumers find the best coverage for their budgets and personal needs. Eric is the CEO of C Street Media, a full-service marketing firm and the co-founder of ProperCents.com, a financial educat...
Eric Stauffer
Updated March 2026
Welcome to our comprehensive article on “States with the Most (& Least) Gun Deaths [+ Causes].”

In this informative piece, we delve into the alarming disparities of gun deaths across different states, uncovering the highest and lowest numbers while examining the underlying causes behind this pressing issue.
- The Northeast and West Coast regions have the fewest gun deaths
- The South experiences the most gun deaths out of every region
- Hawaii sees the fewest firearm-related deaths with 2.5 deaths per 100K residents
- Suicide is the leading cause of firearm deaths, accounting for over 60%
We explore a range of key topics, including societal factors, legislation, and access to mental health services. Our aim is to shed light on the urgent need for comprehensive measures to address this complex problem. To take a proactive step and ensure your safety, enter your ZIP code below to compare rates from the best insurance providers in your area. Let’s work together for a safer future.
Here are some gun violence stats that were taken from the CDC gun deaths database:
According to the Centers for Disease Control and Prevention (CDC), deaths due to gun violence rose by 16.5 percent between 2007 and 2017, countering a long-term downward trend. In 2017 alone, there were 39,773 firearm fatalities nationwide, a rate of 12 fatalities per 100,000 residents.
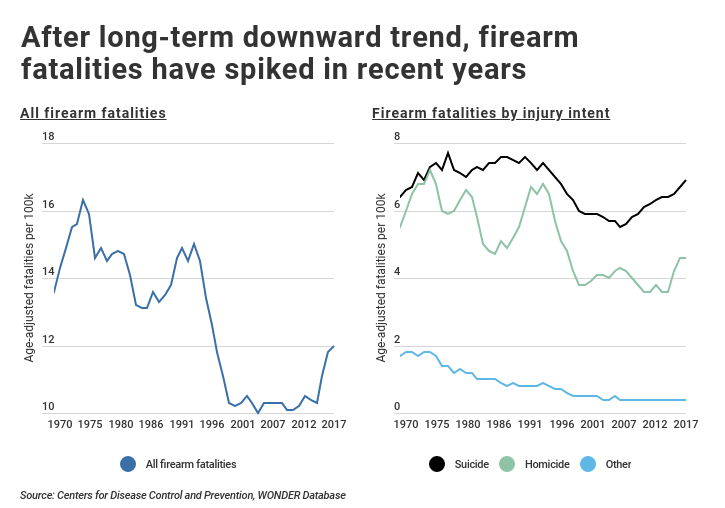
Most firearm fatalities are the result of suicide, homicide, unintentional injuries, or interactions with law enforcement (legal interventions).
While the rates of unintentional injuries, legal intervention, and other less common forms of firearm fatalities have remained relatively flat over the past decade, the rate of firearm-related suicides and firearm-related.
Suicide now represents nearly 60 percent of all firearm fatalities, accounting for 23,854 deaths in 2017.
Although firearm violence is a nationwide issue, the firearm fatality rate varies widely by location. At the state level, certain Midwest and Southern states suffer firearm fatality rates that are 1.5 to two times the national average.
Conversely, Northeast and West Coast states tend to experience lower levels of gun violence. The following graphic is a gun violence by state map which looks at gun violence statistics by state.
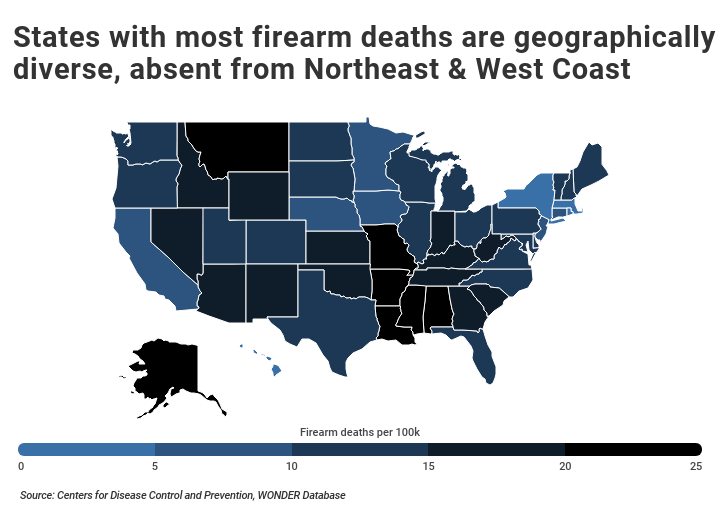
To find which individual states have the highest and lowest firearm fatality rates, our researchers at U.S. Insurance Agents analyzed the cause of death data from the CDC’s WONDER database. To make the data comparable across states, all death rates are age-adjusted and expressed per 100,000 residents.
Additionally, for each state, our researchers identified the 10-year change in firearm deaths, the most common cause of firearm death, the racial group with the highest firearm fatality rate, as well as the county with the highest firearm fatality rate.
If you’re on this page, you’re likely looking for car insurance as well. But if you’re like many Americans, you may find car insurance confusing. The terminology and lack of clear-cut factors that go into your rates make purchasing car insurance a bit like pulling a tooth.
For that reason, we’ve put together a car insurance page that links to articles about numerous car insurance coverages. The page is educational so that you have a better understanding of what car insurance coverages you might need and ones you might not.
While gun violence can raise car insurance rates in your area, getting quotes can help you find savings. If you’re looking to jump right into getting a quote, just enter your ZIP code into our FREE online quote comparison tool. It’ll give you the best car insurance rates for your area based on your demographic information.
Now, here are the states with the highest and lowest gun fatality rates.
10 States with the Highest Firearm Death Rates
#1 – Alaska
- Firearm death rate (age-adjusted): 24.5 per 100k
- 10-year percent change: 35.4%
- Total firearm deaths 2017: 180
- Most common cause of firearm death: Suicide
- Most impacted race/ethnicity: American Indian or Alaska Native
- Most impacted county: Anchorage Borough (24.6 per 100k)
#2 – Alabama
- Firearm death rate (age-adjusted): 22.9 per 100k
- 10-year percent change: 32.4%
- Total firearm deaths 2017: 1,124
- Most common cause of firearm death: Suicide
- Most impacted race/ethnicity: Black or African American
- Most impacted county: Tie: Talladega County, Russell County (34.2 per 100k)
TRENDING
Regardless of your age, we can help you find the right car insurance policy for you. Whether you are looking for AARP auto insurance for seniors, car insurance for a 21-year-old, or single-parent car insurance, we’ve got your back.
#3 – Montana
- Firearm death rate (age-adjusted): 22.5 per 100k
- 10-year percent change: 64.2%
- Total firearm deaths 2017: 244
- Most common cause of firearm death: Suicide
- Most impacted race/ethnicity: White
- Most impacted county: Cascade County (24.6 per 100k)
#4 – Louisiana
- Firearm death rate (age-adjusted): 21.7 per 100k
- 10-year percent change: 9.0%
- Total firearm deaths 2017: 1,008
- Most common cause of firearm death: Homicide
- Most impacted race/ethnicity: Black or African American
- Most impacted county: Orleans Parish (38.2 per 100k)
#5 – Mississippi
- Firearm death rate (age-adjusted): 21.5 per 100k
- 10-year percent change: 17.5%
- Total firearm deaths 2017: 632
- Most common cause of firearm death: Tie: Homicide, Suicide
- Most impacted race/ethnicity: Black or African American
- Most impacted county: Washington County (46.5 per 100k)
DID YOU KNOW?
Members of wholesale clubs like Costco often have access to reduced car insurance rates. Read our guide on buying insurance at wholesale clubs.
Read more: Best Business Insurance for Country Clubs
#6 – Missouri
- Firearm death rate (age-adjusted): 21.5 per 100k
- 10-year percent change: 68.0%
- Total firearm deaths 2017: 1,307
- Most common cause of firearm death: Suicide
- Most impacted race/ethnicity: Black or African American
- Most impacted county: St. Louis County (56.8 per 100k)
#7 – Arkansas
- Firearm death rate (age-adjusted): 20.3 per 100k
- 10-year percent change: 34.4%
- Total firearm deaths 2017: 613
- Most common cause of firearm death: Suicide
- Most impacted race/ethnicity: Black or African American
- Most impacted county: Jefferson County (49.9 per 100k)
#8 – Wyoming
- Firearm death rate (age-adjusted): 18.8 per 100k
- 10-year percent change: 27.9%
- Total firearm deaths 2017: 113
- Most common cause of firearm death: Suicide
- Most impacted race/ethnicity: White
- Most impacted county: Laramie County (20.8 per 100k)
#9 – West Virginia
- Firearm death rate (age-adjusted): 18.6 per 100k
- 10-year percent change: 31.9%
- Total firearm deaths 2017: 348
- Most common cause of firearm death: Suicide
- Most impacted race/ethnicity: White
- Most impacted county: Mercer County (30.1 per 100k)
#10 – New Mexico
- Firearm death rate (age-adjusted): 18.5 per 100k
- 10-year percent change: 24.2%
- Total firearm deaths 2017: 394
- Most common cause of firearm death: Suicide
- Most impacted race/ethnicity: White
- Most impacted county: Otero County (30.2 per 100k)
10 States with the Lowest Firearm Death Rates
#1 – Hawaii
- Firearm death rate (age-adjusted): 2.5 per 100k
- 10-year percent change: 0.0%
- Total firearm deaths 2017: 39
- Most common cause of firearm death: Suicide
- Most impacted race/ethnicity: White
- Most impacted county: NA
#2 – New York
- Firearm death rate (age-adjusted): 3.7 per 100k
- 10-year percent change: -27.5%
- Total firearm deaths 2017: 772
- Most common cause of firearm death: Suicide
- Most impacted race/ethnicity: Black or African American
- Most impacted county: Erie County (7.6 per 100k)
#3 – Massachusetts
- Firearm death rate (age-adjusted): 3.7 per 100k
- 10-year percent change: 2.8%
- Total firearm deaths 2017: 262
- Most common cause of firearm death: Suicide
- Most impacted race/ethnicity: Black or African American
- Most impacted county: Hampden County (8.6 per 100k)
POPULAR
Whether you commute daily or only use your car a few times a week, the importance of having reliable auto insurance can’t be overstated. We can help you easily compare car insurance quotes with our reviews of the best car insurance companies.
#4 – Rhode Island
- Firearm death rate (age-adjusted): 3.9 per 100k
- 10-year percent change: 14.7%
- Total firearm deaths 2017: 43
- Most common cause of firearm death: Suicide
- Most impacted race/ethnicity: White
- Most impacted county: Providence County (4.1 per 100k)
#5 – Connecticut
- Firearm death rate (age-adjusted): 5.1 per 100k
- 10-year percent change: 24.4%
- Total firearm deaths 2017: 188
- Most common cause of firearm death: Suicide
- Most impacted race/ethnicity: Black or African American
- Most impacted county: Hartford County (6.3 per 100k)
#6 – New Jersey
- Firearm death rate (age-adjusted): 5.3 per 100k
- 10-year percent change: 1.9%
- Total firearm deaths 2017: 478
- Most common cause of firearm death: Homicide
- Most impacted race/ethnicity: Black or African American
- Most impacted county: Essex County (12.1 per 100k)
#7 – California
- Firearm death rate (age-adjusted): 7.9 per 100k
- 10-year percent change: -11.2%
- Total firearm deaths 2017: 3184
- Most common cause of firearm death: Suicide
- Most impacted race/ethnicity: Black or African American
- Most impacted county: Mendocino County (21.3 per 100k)
#8 – Minnesota
- Firearm death rate (age-adjusted): 8.2 per 100k
- 10-year percent change: 26.2%
- Total firearm deaths 2017: 465
- Most common cause of firearm death: Suicide
- Most impacted race/ethnicity: Black or African American
- Most impacted county: Ramsey County (9.7 per 100k)
Compare quotes from the top insurance companies and save!Compare The Best Insurance Quotes In The Country
![]() Secured with SHA-256 Encryption
Secured with SHA-256 Encryption
#9 – Nebraska
- Firearm death rate (age-adjusted): 8.3 per 100k
- 10-year percent change: 5.1%
- Total firearm deaths 2017: 160
- Most common cause of firearm death: Suicide
- Most impacted race/ethnicity: White
- Most impacted county: Douglas County (8.5 per 100k)
#10 – Iowa
- Firearm death rate (age-adjusted): 9 per 100k
- 10-year percent change: 80.0%
- Total firearm deaths 2017: 293
- Most common cause of firearm death: Suicide
- Most impacted race/ethnicity: Black or African American
- Most impacted county: Polk County (10.5 per 100k)
All States Ranked by Gun Deaths
If your state was not in either of the lists above, you might be anxious to find out how bad (or not) gun deaths are in your state. The following table is a complete ranking of gun deaths by state from Alaska to Hawaii.
It looks at gun deaths per year in the US both in terms of states and holistically. Through the gun violence statistics per year (specifically 2017), we can see that it is a serious problem.
States with the Most Gun Deaths
| State | Firearm Death Rate | Percent Change | Firearms Deaths: 2017 | Most Common Cause | Race Most Impacted | County Most Impacted | Rank |
|---|---|---|---|---|---|---|---|
| HI | 2.5 | 0.0% | 39 | Suicide | White, Not Hispanic or Latino | NA | 51 |
| NY | 3.7 | -27.5% | 772 | Suicide | Black or African American, Not Hispanic or Latino | Erie County (7.6 per 100k) | 50 |
| MA | 3.7 | 2.8% | 262 | Suicide | Black or African American, Not Hispanic or Latino | Hampden County (8.6 per 100k) | 49 |
| RI | 3.9 | 14.7% | 43 | Suicide | White, Not Hispanic or Latino | Providence County (4.1 per 100k) | 48 |
| CT | 5.1 | 24.4% | 188 | Suicide | Black or African American, Not Hispanic or Latino | Hartford County (6.3 per 100k) | 47 |
| NJ | 5.3 | 1.9% | 478 | Homicide | Black or African American, Not Hispanic or Latino | Essex County (12.1 per 100k) | 46 |
| CA | 7.9 | -11.2% | 3184 | Suicide | Black or African American, Not Hispanic or Latino | Mendocino County (21.3 per 100k) | 45 |
| MN | 8.2 | 26.2% | 465 | Suicide | Black or African American, Not Hispanic or Latino | Ramsey County (9.7 per 100k) | 44 |
| NE | 8.3 | 5.1% | 160 | Suicide | White, Not Hispanic or Latino | Douglas County (8.5 per 100k) | 43 |
| IA | 9 | 80.0% | 293 | Suicide | Black or African American, Not Hispanic or Latino | Polk County (10.5 per 100k) | 42 |
| NH | 10.4 | 85.7% | 146 | Suicide | White, Not Hispanic or Latino | Rockingham County (11 per 100k) | 41 |
| WI | 10.6 | 23.3% | 624 | Suicide | Black or African American, Not Hispanic or Latino | Milwaukee County (19.2 per 100k) | 40 |
| WI | 11.1 | 33.7% | 849 | Suicide | Black or African American, Not Hispanic or Latino | Lewis County (25.1 per 100k) | 39 |
| MI | 11.3 | 2.7% | 1138 | Suicide | Black or African American, Not Hispanic or Latino | Wayne County (19.7 per 100k) | 38 |
| VT | 11.7 | 42.7% | 70 | Suicide | White, Not Hispanic or Latino | NA | 37 |
| ME | 11.7 | 53.9% | 172 | Suicide | White, Not Hispanic or Latino | Kennebec County (15.8 per 100k) | 36 |
| DE | 11.7 | 31.5% | 111 | Homicide | Black or African American, Not Hispanic or Latino | New Castle County (12.4 per 100k) | 35 |
| VA | 11.9 | 14.4% | 1041 | Suicide | Black or African American, Not Hispanic or Latino | Roanoke city (23.3 per 100k) | 34 |
| SD | 11.9 | 91.9% | 101 | Suicide | White, Not Hispanic or Latino | Minnehaha County (13.6 per 100k) | 33 |
| OR | 12.1 | 22.2% | 528 | Suicide | White, Not Hispanic or Latino | Klamath County (31.5 per 100k) | 32 |
| IL | 12.1 | 49.4% | 1543 | Homicide | Black or African American, Not Hispanic or Latino | St. Clair County (27.6 per 100k) | 31 |
| MD | 12.3 | 1.7% | 742 | Homicide | Black or African American, Not Hispanic or Latino | Baltimore city (42.6 per 100k) | 30 |
| TX | 12.4 | 13.8% | 3513 | Suicide | Black or African American, Not Hispanic or Latino | Wilson County (54.3 per 100k) | 29 |
| FL | 12.4 | 2.5% | 2724 | Suicide | Black or African American, Not Hispanic or Latino | Highlands County (21.7 per 100k) | 28 |
| PA | 12.5 | 19.0% | 1636 | Suicide | Black or African American, Not Hispanic or Latino | Cambria County (21.3 per 100k) | 27 |
| DC | 13.1 | -39.4% | 100 | Homicide | Black or African American, Not Hispanic or Latino | District of Columbia (13.1 per 100k) | 26 |
| ND | 13.2 | 57.1% | 103 | Suicide | White, Not Hispanic or Latino | NA | 25 |
| CO | 13.4 | 28.8% | 779 | Suicide | Black or African American, Not Hispanic or Latino | Pueblo County (21.8 per 100k) | 24 |
| OH | 13.7 | 42.7% | 1589 | Suicide | Black or African American, Not Hispanic or Latino | Trumbull County (22.7 per 100k) | 23 |
| NC | 13.7 | 12.3% | 1430 | Suicide | Black or African American, Not Hispanic or Latino | Surry County (31.6 per 100k) | 22 |
| UT | 14 | 30.8% | 410 | Suicide | White, Not Hispanic or Latino | Washington County (18.1 per 100k) | 21 |
| IN | 15.3 | 45.7% | 1016 | Suicide | Black or African American, Not Hispanic or Latino | Marion County (23.1 per 100k) | 20 |
| GA | 15.4 | 14.1% | 1623 | Suicide | Black or African American, Not Hispanic or Latino | Muscogee County (29.6 per 100k) | 19 |
| AZ | 15.8 | 2.6% | 1134 | Suicide | Black or African American, Not Hispanic or Latino | Navajo County (31.7 per 100k) | 18 |
| KS | 16 | 53.8% | 466 | Suicide | Black or African American, Not Hispanic or Latino | Wyandotte County (28.5 per 100k) | 17 |
| KY | 16.2 | 14.1% | 730 | Suicide | Black or African American, Not Hispanic or Latino | Jefferson County (21 per 100k) | 16 |
| ID | 16.4 | 29.1% | 280 | Suicide | White, Not Hispanic or Latino | Bannock County (26.4 per 100k) | 15 |
| NV | 16.7 | 5.0% | 508 | Suicide | Black or African American, Not Hispanic or Latino | Tie: Washoe County, Clark County (16.4 per 100k) | 14 |
| OK | 17.2 | 30.3% | 681 | Suicide | Black or African American, Not Hispanic or Latino | Comanche County (20.4 per 100k) | 13 |
| SC | 17.7 | 35.1% | 893 | Suicide | Black or African American, Not Hispanic or Latino | Darlington County (37.9 per 100k) | 12 |
| TN | 18.4 | 24.3% | 1246 | Suicide | Black or African American, Not Hispanic or Latino | Shelby County (26.6 per 100k) | 11 |
| NM | 18.5 | 24.2% | 394 | Suicide | White, Not Hispanic or Latino | Otero County (30.2 per 100k) | 10 |
| WV | 18.6 | 31.9% | 348 | Suicide | White, Not Hispanic or Latino | Mercer County (30.1 per 100k) | 9 |
| WY | 18.8 | 27.9% | 113 | Suicide | White, Not Hispanic or Latino | Laramie County (20.8 per 100k) | 8 |
| AR | 20.3 | 34.4% | 613 | Suicide | Black or African American, Not Hispanic or Latino | Jefferson County (49.9 per 100k) | 7 |
| MO | 21.5 | 68.0% | 1307 | Suicide | Black or African American, Not Hispanic or Latino | St. Louis city (56.8 per 100k) | 6 |
| MS | 21.5 | 17.5% | 632 | Tie: Homicide, Suicide | Black or African American, Not Hispanic or Latino | Washington County (46.5 per 100k) | 5 |
| LA | 21.7 | 9.0% | 1008 | Homicide | Black or African American, Not Hispanic or Latino | Orleans Parish (38.2 per 100k) | 4 |
| MT | 22.5 | 64.2% | 244 | Suicide | White, Not Hispanic or Latino | Cascade County (24.6 per 100k) | 3 |
| AL | 22.9 | 32.4% | 1124 | Suicide | Black or African American, Not Hispanic or Latino | Tie: Talladega County, Russell County (34.2 per 100k) | 2 |
| AK | 24.5 | 35.4% | 180 | Suicide | American Indian or Alaska Native, Not Hispanic or Latino | Anchorage Borough (24.6 per 100k) | 1 |
Methodology: Determining the Ranking for Gun Deaths by State
All gun death statistics were obtained from the Centers for Disease Control’s WONDER database. Age-adjusted death rates were obtained for all deaths caused by firearms in 2007 and in 2017, the most recent year for which information is available.
The change in the death rate was calculated as the percent change in the age-adjusted death rate between 2007 and 2017. All death rates are reported as the number of deaths per 100,000 residents.
This statistic levels the playing field and makes sure that the “worst states for gun deaths” are not just the states with the largest populations. This method of statistical analysis might also be thought of as:
- States with the most gun deaths per capita
- States with the most gun violence per capita
For the purpose of this analysis, persons of Hispanic or Latino descent were categorized as a separate racial group independent from non-Hispanic whites, non-Hispanic blacks or African Americans, non-Hispanic Asians or Pacific Islanders, and non-Hispanic American Indians or Alaskan Natives.
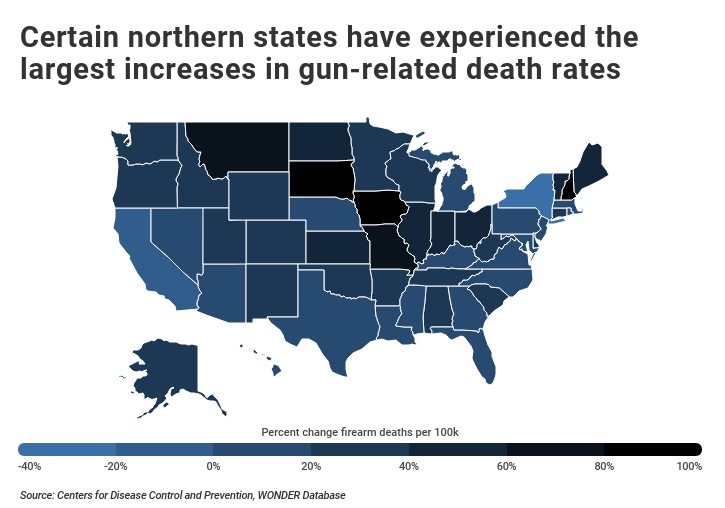
Between 2007 and 2017, South Dakota had the largest jump in the firearm death rate, with an increase of over 91 percent.
By contrast, New York, California, and the District of Columbia all had decreases in the firearm death rate over this time period.
Overall, the states with the highest increases in firearm fatalities from 2007 to 2017 are located in the North, with states like New Hampshire, South Dakota, Montana, and Maine all experiencing increases over 50 percent.
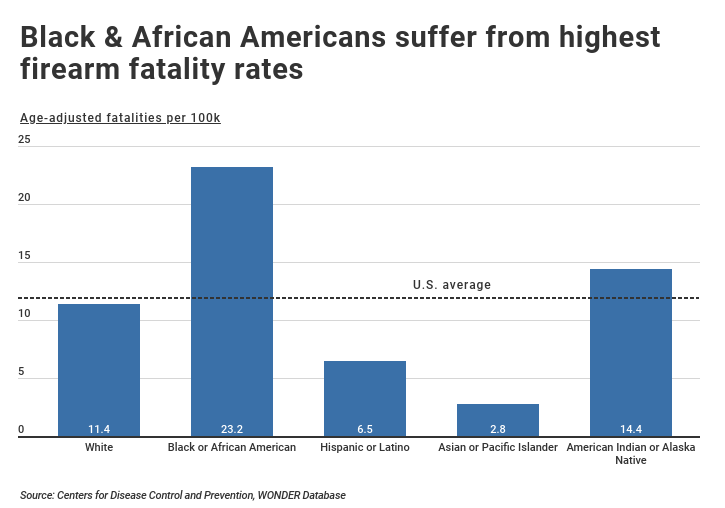
In addition, some demographics are more adversely affected by gun violence than others. Specifically, African Americans suffer the highest firearm fatality rate at 23.2 deaths per 100,000, nearly double the national rate.
At a more granular level, African Americans are the most impacted racial group in 35 states. Conversely, Asians and Hispanics are the least likely groups to be victims of gun violence.
With three out of every 10 Americans owning a firearm, gun culture is still deeply ingrained in American society. High levels of gun ownership, as well as partisan divides, have made legislative action difficult in curtailing the rising number of gun-related deaths.
However, data from Pew Research shows that strong majorities of both gun owners and non-owners support certain policies to prevent gun violence. In particular, both gun owners and non-owners support limiting gun access for people with mental illnesses and individuals who are on the federal no-fly or watch lists.
Furthermore, most gun owners and non-owners support background checks for gun purchases made through private sales and at gun shows. Ultimately, thwarting gun violence will likely require cultural and legislative changes at the local, state, and national levels.
Even though gun violence and gun-related deaths can raise auto insurance rates in your area, shopping around can help you save money. Just plug in your ZIP code into our FREE online quote generator to receive the best car insurance rates for your area based on your demographic information and driving history.

Frequently Asked Questions
What is the state with the highest gun violence rate?
According to data from the CDC’s WONDER database, Alaska has the highest firearm death rate in the United States.
What are the states with the highest and lowest gun fatality rates?
The top 10 states with the highest gun death rates are Alaska, Alabama, Montana, Louisiana, Mississippi, Missouri, Arkansas, Wyoming, West Virginia, and New Mexico. The top 10 states with the lowest gun death rates are Hawaii, New York, Massachusetts, Rhode Island, Connecticut, New Jersey, California, Minnesota, Nebraska, and Iowa.
What are the common causes of firearm fatalities?
According to the CDC, the most common causes of firearm fatalities are suicide, homicide, unintentional injuries, or interactions with law enforcement (legal interventions).
Who is most impacted by gun violence?
African Americans suffer the highest firearm fatality rate at 23.2 deaths per 100,000, nearly double the national rate.
Can gun violence impact car insurance rates?
Yes, gun violence and gun-related deaths can raise auto insurance rates in your area.
How can I save money on car insurance?
Comparing car insurance quotes from multiple insurance companies can help you find the best rates. You can use our free online quote generator to receive the best car insurance rates for your area based on your demographic information and driving history.
What policies do gun owners and non-owners support to prevent gun violence?
According to data from Pew Research, both gun owners and non-owners support limiting gun access for people with mental illnesses and individuals who are on the federal no-fly or watch lists. Furthermore, most gun owners and non-owners support background checks for gun purchases made through private sales and at gun shows.
Can gun violence impact other types of insurance?
Yes, gun violence can impact other types of insurance, such as homeowner’s insurance and liability insurance. It’s important to speak with your insurance agent about any concerns or questions you may have.
Related Articles
-
Oct 2024

Paycheck Protection Program for Female Business Owners [10 Best States + Insurance Advice]
-
Oct 2024
Urban Bicycling Safety – A Complete Guide to Biking Safely in the City
-
Oct 2024
Beyond the Home: A History of Women’s Rights, Milestones and Quotes
-
Oct 2024
Solar Power in the Home
-
Oct 2024
Heating and Cooling: Understanding Temperature
-
Oct 2024
A Comprehensive Guide to Typing at Home


Get a FREE Quote in Minutes
Insurance rates change constantly — we help you stay ahead by making it easy to compare top options and save.
![]() Secured with SHA-256 Encryption
Secured with SHA-256 Encryption


